Gauge Generator guide
Gauge Generator is a browser-based vector editor for designing gauges, dials, instrument faces, and other value-driven graphics. You build a project from reusable Ranges and visual layers, preview every change immediately, then download the editable project or export production-ready artwork.
Everything stays in your browser. There is no account or cloud workspace: download your project file when you want a durable copy.
What you can build
Gauge Generator combines precise physical dimensions with a layer workflow familiar from graphics tools. It is suited to speedometers, tachometers, pressure gauges, battery indicators, control panels, and decorative dials.
- Work on a rectangular canvas measured in millimetres.
- Build several related scales from up to five independent Ranges.
- Mix linear, logarithmic, and custom value mappings.
- Arrange, duplicate, hide, and reorder visual layers.
- Edit geometry directly on the preview with handles and overlays.
- Undo and redo project changes and restore local autosaves.
- Download the editable JSON project or export SVG, PNG, and PDF output.
Start your first project
The fastest way to learn the editor is to open Examples in the top toolbar. Choose a design, open it, and inspect its layers and properties. Examples are normal editable projects, so experimenting with them is safe.
To start from scratch:
- Open the editor and choose Create first Range.
- Name the Range and define its centre, radius, angles, value domain, and mapping.
- Return to Layers, choose Layer, and select a visual layer type.
- Pick the source Range, create the layer, and adjust its properties.
- Repeat until the preview matches your design.
- Use Download to keep the editable project and Export to create artwork.
A Range must exist before you add a visual layer. Think of it as the invisible coordinate system and value scale shared by everything drawn around one dial.
Interface tour
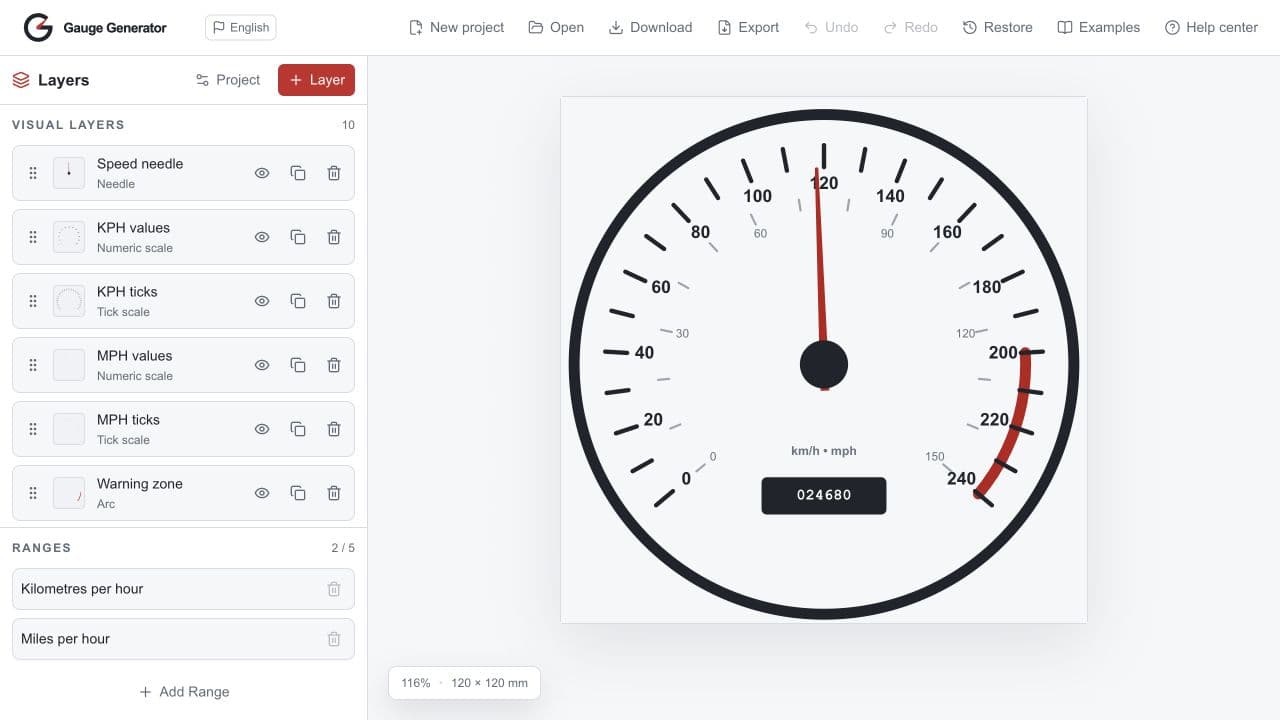
The workspace has three main regions: the toolbar across the top, the sidebar on the left, and the live canvas preview on the right.
Project toolbar
The toolbar manages the whole project:
| Action | What it does |
|---|---|
| New project | Starts with an empty project after confirming unsaved work. |
| Open | Validates and opens a Gauge Generator JSON project. |
| Download | Saves the current editable project to your computer. |
| Export | Creates SVG, PNG, or PDF files, including per-layer output. |
| Undo / Redo | Moves through recent successful project changes. |
| Restore | Opens one of the five latest autosaves stored in this browser. |
| Examples | Opens complete designs that you can preview and edit. |
| Help center | Opens this guide in a separate browser tab. |
On narrower windows, less frequently used actions move into the More actions menu.
Layers sidebar
The sidebar separates Ranges from Visual layers. Select an item to edit it, use the eye button to control a visual layer's visibility, and drag visual layers to change their stacking order. The first visual layer in the list is the topmost one in the finished artwork.
Hover a visual-layer thumbnail to isolate it temporarily in the preview. This is a quick inspection tool: it does not change the project, the selection, or the exported result.
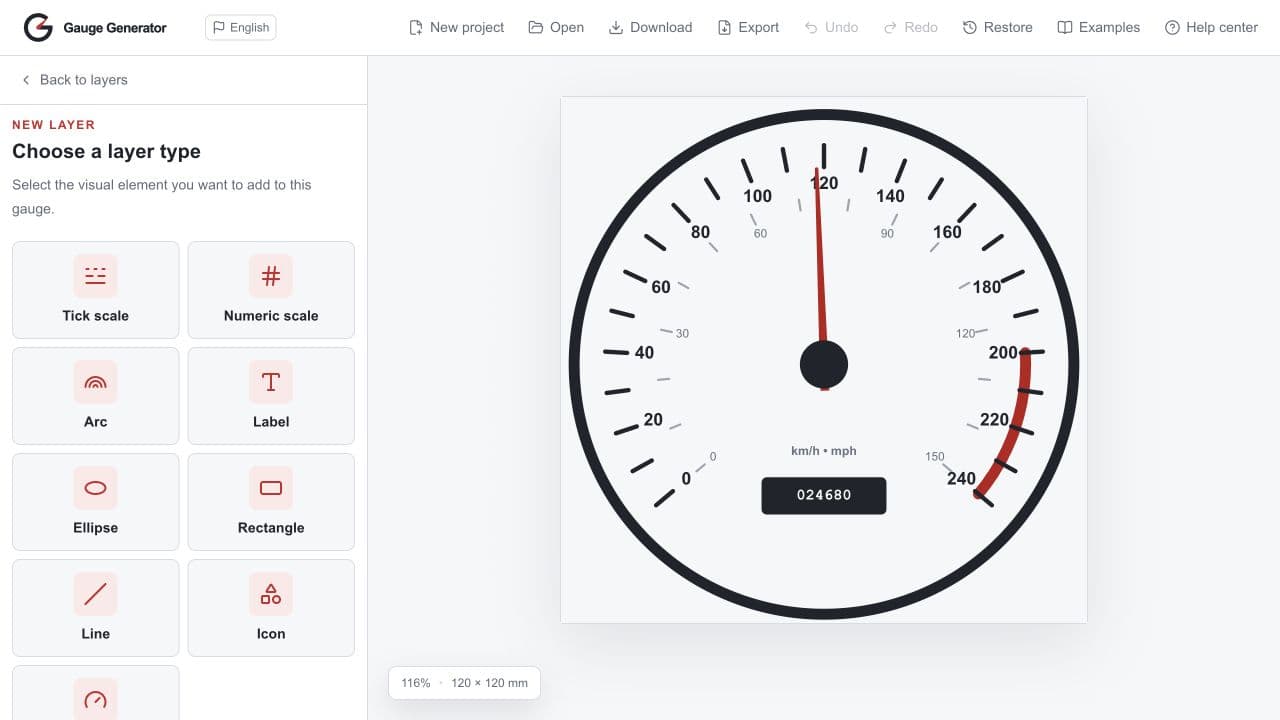
The Project view contains canvas settings such as width, height, background, transparency, and snapping. The layer picker opens after you press Layer and lets you choose a type before anything is added to the project.
Properties and editing controls
Selecting a Range or visual layer opens its property editor. Numeric fields use the same physical units as the project, while sliders provide a quick way to explore valid values. Changes appear immediately in the preview.
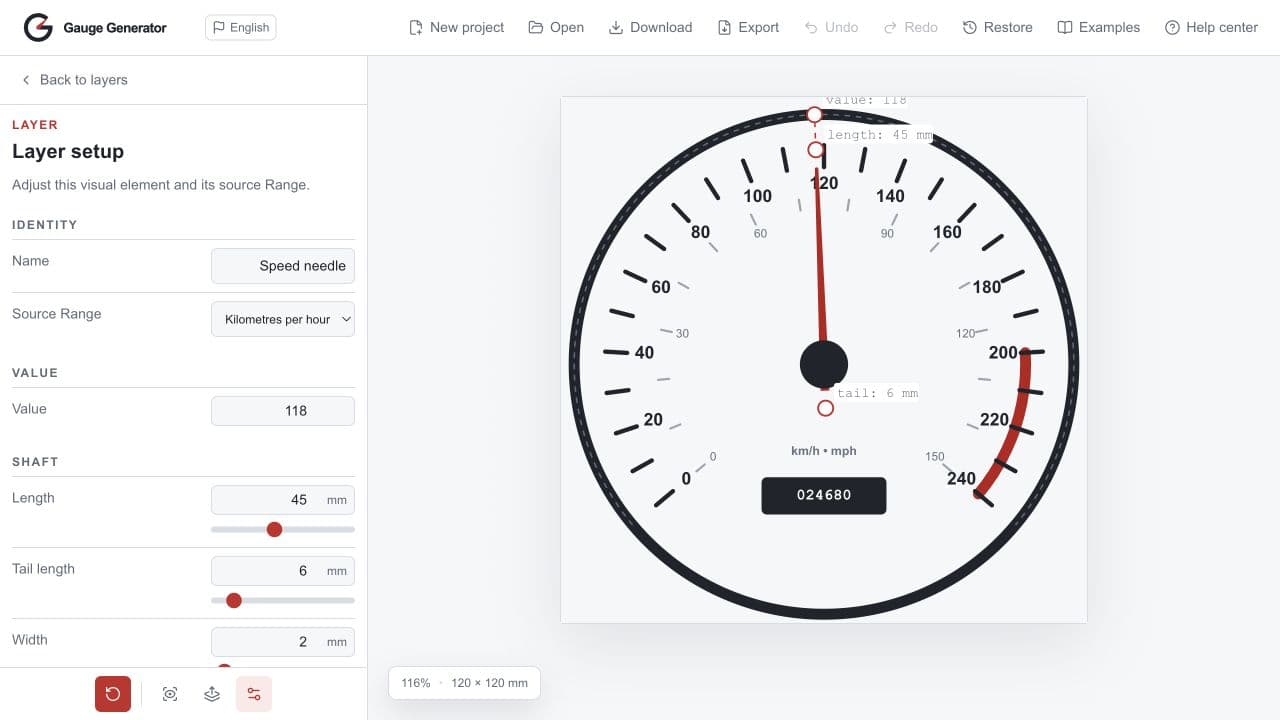
When a visual layer is being edited, the controls at the bottom of the sidebar can:
- isolate the edited layer;
- bring it temporarily to the front;
- show or hide its editing overlay;
- reset its visual settings without changing its identity, name, visibility, or source Range.
Many layers also expose handles directly on the preview. Dragging a handle and editing the related field are two views of the same project data.
Typography controls include a small cross-platform starter set. Press Load local fonts to let a supported browser list the font families installed on your computer, then select any of them from the same Font menu. The browser asks for permission before revealing this list. Gauge Generator stores only the family name in project JSON—the font file is never copied into the project—so opening the file on another computer may produce a fallback font until the same family is installed there.
Live preview
The preview always fits the complete canvas into the available space. Its bottom-left label shows the canvas dimensions and fitted zoom. Editing overlays are only helpers: they are never included in exports.
Clicking empty canvas space does not change the selection. If the preview looks unexpectedly simple, check whether a thumbnail is being hovered, a layer is hidden, or an isolation modifier is enabled.
Ranges: the foundation
A Range is not a visible layer. It defines shared geometry and maps project values to positions along that geometry. Every visual layer references one Range, which keeps ticks, numbers, arcs, labels, and needles aligned even when you reshape the dial.
A Range controls:
- centre and radius on the canvas;
- start angle and opening angle;
- rounded-square path shape, from nearly square to circular;
- ascending or descending value direction;
- minimum and maximum integer values;
- linear, logarithmic, or custom value mapping.
Scale definitions
Linear distributes equal value changes over equal distances. It is the best default for most instruments.
Logarithmic gives different amounts of path space to low and high values. Use detail emphasis to decide which end of the domain needs more room.
Custom maps values through a set of increasing control points. Use it for non-standard scales derived from measurements or an existing physical face.
Changing a Range can affect every linked layer. The editor warns about large dependent changes and clamps geometry or visible values when necessary to keep the project valid.
Visual layer types
Visual layers are emitted in their list order: the first item is visually on top. Every one has a required name, a visibility state, and a source Range.
Tick scale
Creates repeated marks along the source Range. Set the visible start and end values, positive step, radius offset, tick length, width, and colour. Tick positions always follow the Range mapping, so the same settings work with circular, rounded-square, logarithmic, and custom scales.
Numeric scale
Places formatted numbers along the Range. Choose the visible value interval and step, then control radius, orientation, font, size, colour, emphasis, multiplier, and decimal places. The stored scale values remain integers; fractional labels are presentation created by the multiplier and decimal settings.
Label
Adds free text using the shared typography controls. A label can be positioned as a normal point object with offsets and rotation, or flow along a selected value interval of the Range path. Text-on-path labels support alignment and direction without storing manual angles.
Arc
Draws a coloured band over a non-zero value interval, ideal for warnings, targets, and operating zones. Control the start and end values, radius offset, stroke width, colour, and rounded ends. Its angles are always derived from the source Range.
Needle
Shows one value on the Range. Adjust its value, forward length, tail, width, tip style, colours, and optional hub. The pivot is always the Range centre, which keeps the needle aligned when the Range moves.
Ellipse and rectangle
Add planar shapes for hubs, panels, masks, and decorative construction. Both support independent width and height, centre offsets, rotation, fill, border colour, and border width. Rectangles also support rounded corners.
Line
Adds a straight construction or indicator line positioned relative to the Range centre. Edit its centre, length, rotation, width, and colour. The preview overlay exposes its centre and both endpoints for direct manipulation.
Icon
Places an icon from the Lucide catalogue. Search the icon browser, then adjust its width, height, centre, rotation, colour, and stroke width. Icons remain vector shapes in SVG and PDF exports.
Working with projects
Gauge Generator project files are validated JSON documents containing canvas settings, Ranges, visual layers, and project metadata. Open replaces the current project only after the file passes validation.
The editor stores local autosaves every few minutes and retains the five newest snapshots. Autosaves are a recovery aid tied to this browser, not a replacement for downloaded project files.
Use:
- Download when you want to continue editing later;
- SVG for scalable vector artwork and further editing;
- PNG for a ready-to-use raster image at a selected DPI;
- PDF for printing on A4 or A3, either as the complete design or one visible layer per page.
Transparent canvas background is enabled by default. A saved background colour is retained while transparency is on and becomes visible again when transparency is disabled.
Practical workflow
- Set the canvas size and snapping before fine positioning.
- Build and verify the Range geometry first.
- Add the tick and numeric scales so the value system is easy to read.
- Add arcs, labels, and a needle for meaning and hierarchy.
- Finish with planar shapes, lines, and icons.
- Use thumbnail hover and editing isolation to inspect complex stacks.
- Download the project, then export the final deliverables.
For a production face, export a quick draft early. Checking the real print size catches spacing and stroke-width problems that are easy to miss on a fitted screen preview.
Build timelapses
Watch how Gauge Generator examples are built in these timelapse videos. Play them here or open them directly on YouTube.
Ready to experiment? Open the editor or begin with a complete project from Examples.